FRESH DATA SUGGESTIONS: ECONOMY STILL ON TRACK
Stocks ended the second week of the new quarter on a high note, giving the Dow its first close over 18,000 for the month. Investors took confidence from some major corporate deals as well as fresh data that suggests the economy is still on track.[1] For the week, the S&P 500 added 1.70%, the Dow grew 1.66%, and the NASDAQ gained 2.23%.[2]
With earnings season in focus, investors have temporarily put Fed worries and economic issues on the back burner in favor of seeing how U.S. businesses performed last quarter. Thomson Reuters analysts predict that S&P 500 companies saw their profits decline by 2.9% from Q1 2014.[3] Falling oil prices and a strong dollar likely chipped away at energy company earnings as well as those of firms that depend on overseas sales (and had to convert profits back into dollars).
Earnings estimates have come down sharply in recent months. In the chart below, you can see that for the past year, the trend has been for earnings expectations to start relatively high (in blue), drop significantly as the quarter proceeds (in red), and then, in three of the last four quarters, exceed expectations (in green).[4]
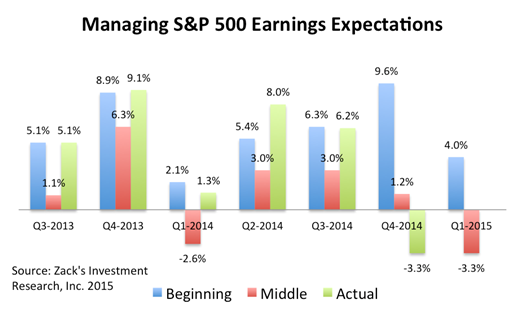
Corporate managers have an incentive to set the bar low so that they can over-deliver on earnings and reap the reward as investors react positively to the news. However, past performance is no guarantee of future return, and we’re not guaranteed to see positive earnings surprises this season. The size of negative earnings revisions is unusually large as companies were forced to account for slower economic growth and volatile oil prices. However, we can remain hopeful that the historical trend will hold.
As we look toward the official start of earnings season this week, we can count on seeing some winners and losers. While energy companies will likely be hit hard by petroleum prices, financial firms and medical firms may see outsized performance. Though we can’t predict the market, we can stay alert for opportunities amid the potential volatility.
ECONOMIC CALENDAR:
Monday: Treasury Budget
Tuesday: PPI-FD, Retail Sales, Business Inventories
Wednesday: Empire State Mfg. Survey, Industrial Production, Housing Market Index, EIA Petroleum Status Report, Beige Book, Treasury International Capital
Thursday: Housing Starts, Jobless Claims, Philadelphia Fed Business Outlook Survey
Friday: Consumer Price Index, Consumer Sentiment

Notes: All index returns exclude reinvested dividends, and the 5-year and 10-year returns are annualized. Sources: Yahoo! Finance and Treasury.gov. International performance is represented by the MSCI EAFE Index. Corporate bond performance is represented by the DJCBP. Past performance is no guarantee of future results. Indices are unmanaged and cannot be invested into directly.
HEADLINES:
Wholesale inventories edge up in February. Warehouse stocks of products for sale rose slightly in February, indicating that businesses may not be restocking aggressively because of weak sales.[5]
Import prices fall in March. The cost of imported goods fell last month as rising oil costs were offset by declining prices elsewhere. Import prices are a major contributor to inflation calculations and weak inflation may delay the Fed’s interest rate increases.[6]
Weekly jobless claims rise less than expected. The number of Americans filing for new unemployment benefits rose slightly last week, bringing the four-week average to the lowest level since 2000. These numbers suggest that the slow job growth in March was a seasonal fluke.[7]
Oil prices stabilize on production plateau. Global oil prices rose for the fourth straight week on expectations that drilling production will stabilize and the supply glut will recede. The number of oil rigs in the U.S. has dropped significantly, indicating that domestic production may be topping out.[8]
These are the views of Platinum Advisor Marketing Strategies, LLC, and not necessarily those of the named representative, Broker dealer or Investment Advisor, and should not be construed as investment advice. Neither the named representative nor the named Broker dealer or Investment Advisor gives tax or legal advice. All information is believed to be from reliable sources; however, we make no representation as to its completeness or accuracy. Please consult your financial advisor for further information.
Investing involves risk including the potential loss of principal. No investment strategy can guarantee a profit or protect against loss in periods of declining values.
Diversification does not guarantee profit nor is it guaranteed to protect assets.
The Standard & Poor’s 500 (S&P 500) is an unmanaged group of securities considered to be representative of the stock market in general.
The Dow Jones Industrial Average is a price-weighted average of 30 significant stocks traded on the New York Stock Exchange and the NASDAQ. The DJIA was invented by Charles Dow back in 1896.
The Nasdaq Composite is an index of the common stocks and similar securities listed on the NASDAQ stock market and is considered a broad indicator of the performance of stocks of technology companies and growth companies.
The MSCI EAFE Index was created by Morgan Stanley Capital International (MSCI) that serves as a benchmark of the performance in major international equity markets as represented by 21 major MSCI indexes from Europe, Australia and Southeast Asia.
The Dow Jones Corporate Bond Index is a 96-bond index designed to represent the market performance, on a total-return basis, of investment-grade bonds issued by leading U.S. companies. Bonds are equally weighted by maturity cell, industry sector, and the overall index.
The S&P/Case-Shiller Home Price Indices are the leading measures of U.S. residential real estate prices, tracking changes in the value of residential real estate. The index is made up of measures of real estate prices in 20 cities and weighted to produce the index.
The 10-year Treasury Note represents debt owed by the United States Treasury to the public. Since the U.S. Government is seen as a risk-free borrower, investors use the 10-year Treasury Note as a benchmark for the long-term bond market.
Google Finance is the source for any reference to the performance of an index between two specific periods.
Opinions expressed are subject to change without notice and are not intended as investment advice or to predict future performance.
Past performance does not guarantee future results.
You cannot invest directly in an index.
Consult your financial professional before making any investment decision.
Fixed income investments are subject to various risks including changes in interest rates, credit quality, inflation risk, market valuations, prepayments, corporate events, tax ramifications and other factors.
By clicking on these links, you will leave our server, as they are located on another server. We have not independently verified the information available through this link. The link is provided to you as a matter of interest. Please click on the links below to leave and proceed to the selected site.
- http://www.cnbc.com/
- http://tinyurl.com/kmt7qdp
- http://www.reuters.com/
- http://www.zacks.com/
- http://www.cnbc.com/
- http://www.reuters.com/
- http://www.foxbusiness.com/
- http://www.foxbusiness.com/
The information presented is for educational purposes only and should not be considered personalized investment, tax, or legal advice.