

What History Tells Us About Markets After Midterm Elections
With midterm elections next week and a lot of noise in the headlines, I wanted to share some perspective.
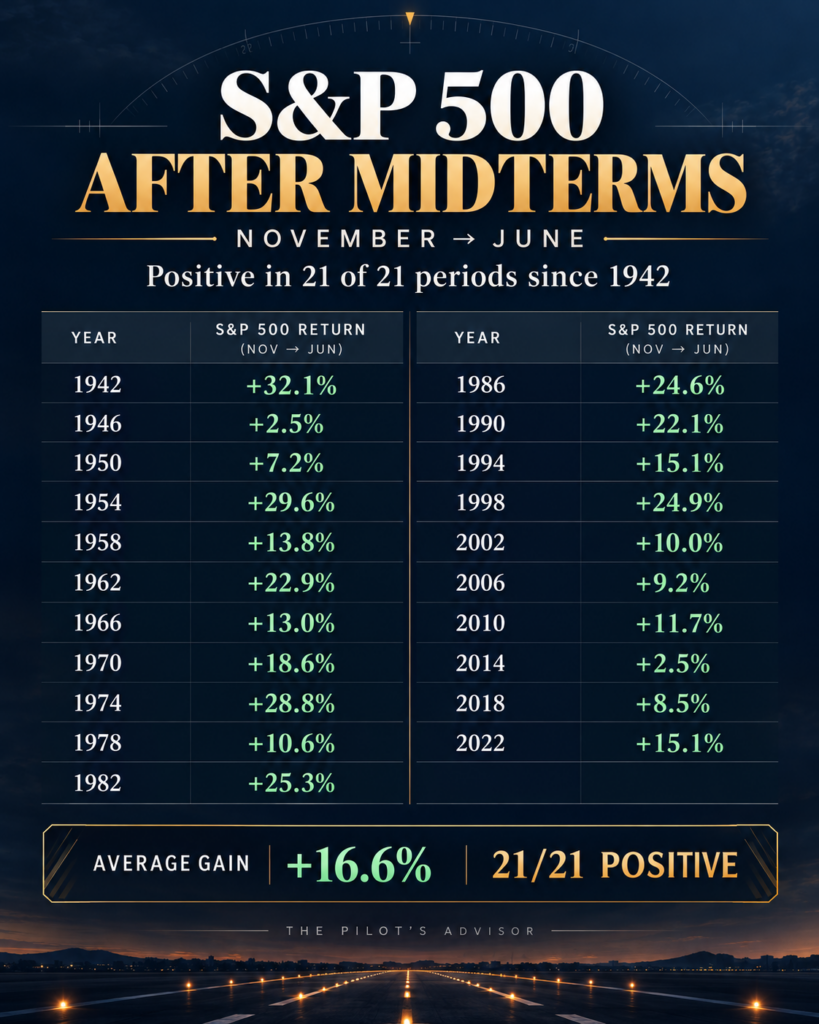
The chart attached looks at how the S&P 500 has done from November of a midterm year through the following June. Since 1942, that stretch has been positive in all 21 midterm periods, with an average gain of about 16.6%.
Why? One common explanation is that markets dislike uncertainty. Once the election is decided, whichever way it goes, investors tend to refocus on the economy and earnings.
Two important caveats:
– History is not a forecast. A 21-for-21 record can end, and markets can and do fall for reasons that have nothing to do with elections.
– Your plan shouldn’t depend on any one election. The best move for most people is the same as always: stay diversified, stick to your plan, and don’t make big changes based on headlines.
If the news has you wondering whether your portfolio is set up right, I’m always happy to talk it through.
The information presented is for educational purposes only and should not be considered personalized investment, tax, or legal advice.